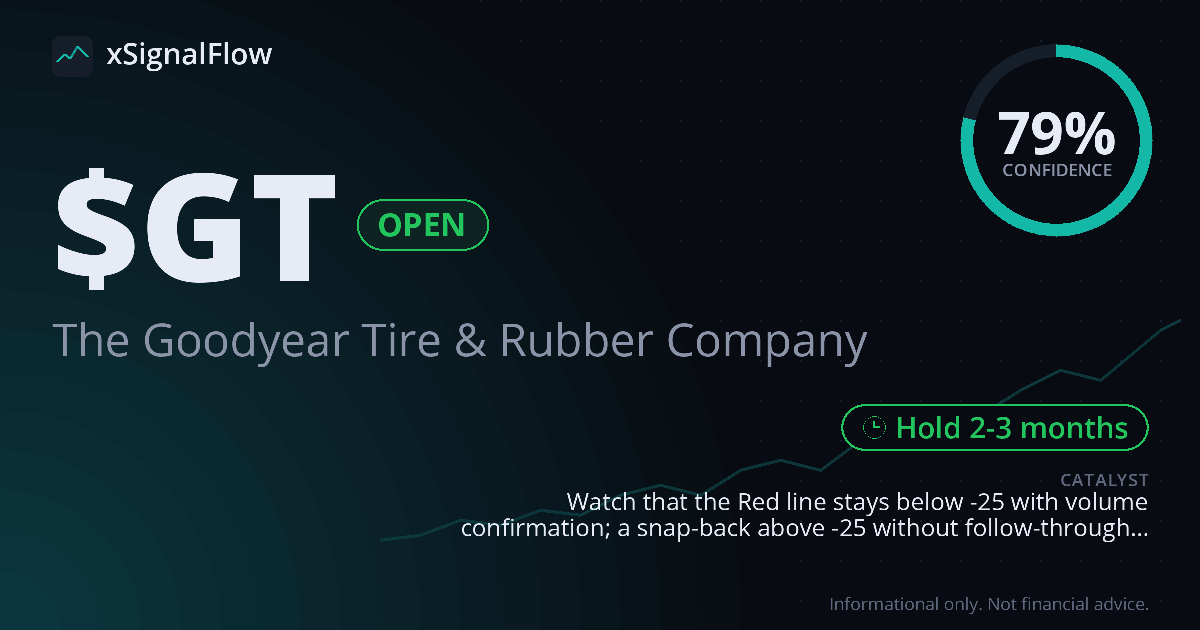
Hold2-3 months
Entry$5.36Now$4.46PnL-16.81%
79%
confidence
Angle GT's 6-day stochastic Red line broke below -25 after a 10% slide from the 5-day high.
Goodyear printed a Red-line washout: the 6-day stochastic dropped through -25 after a 10% drawdown from the 5-day high, with the 2-day Yellow line still above -20 and volume running above 1.2x average. This is a stochastic exhaustion entry, not an RSI reclaim. Hold while Red stays washed out and watch for follow-through on volume.
HOLD AI Status: GT still shows a washed-out stochastic posture with price hugging the lower Bollinger band while the primary trend remains weak below the EMA20.
Stochastics continue to favor the exhaustion thesis with %K at 3.8 and %D at 5.9 in oversold territory, consistent with the Red-line washout angle. Bollinger %B near 0.14 keeps the close at the lower band with bandwidth around 24%, and daily RSI near 31 with weekly RSI near 30 supports rebound potential even though MACD histogram is still negative and price sits about 8% below the EMA20 in a strong downtrend. Volume at 0.80x average and falling OBV temper confirmation, while bearish DMI with elevated ADX flags trend pressure that needs participation to validate follow-through.
Triangulation
Indicators as of Oct 15, 2026 12:15 PM PT
| Trend | CAUTION | EMA20<SMA50<SMA200 · ADX 33.1 strong · -8.4% vs EMA20 · close<EMA20 · -DI > +DI |
| Momentum | HOLD | RSI 31.4 · RSIw 31.9 · hist -0.01 · MACD<signal |
| Stochastics | HOLD | %K/4 · %D/6 · oversold |
| Bollinger | HOLD | %B 0.14 · lower band · BW 23.7% · ATR 4.7% |
| Weekly | WATCHING | RSIw 29.9 · RSI<RSI-SMA · hist -0.15 · close<SMA50 |
| Price action | WATCHING | 20d 3% · 52w 1% · lower highs (3) |
| Volume | HOLD | 0.80x avg · OBV ↓ |
| Position | CAUTION | PnL -16.81% · peak +3.55% · dd -18.67% · 23d held |