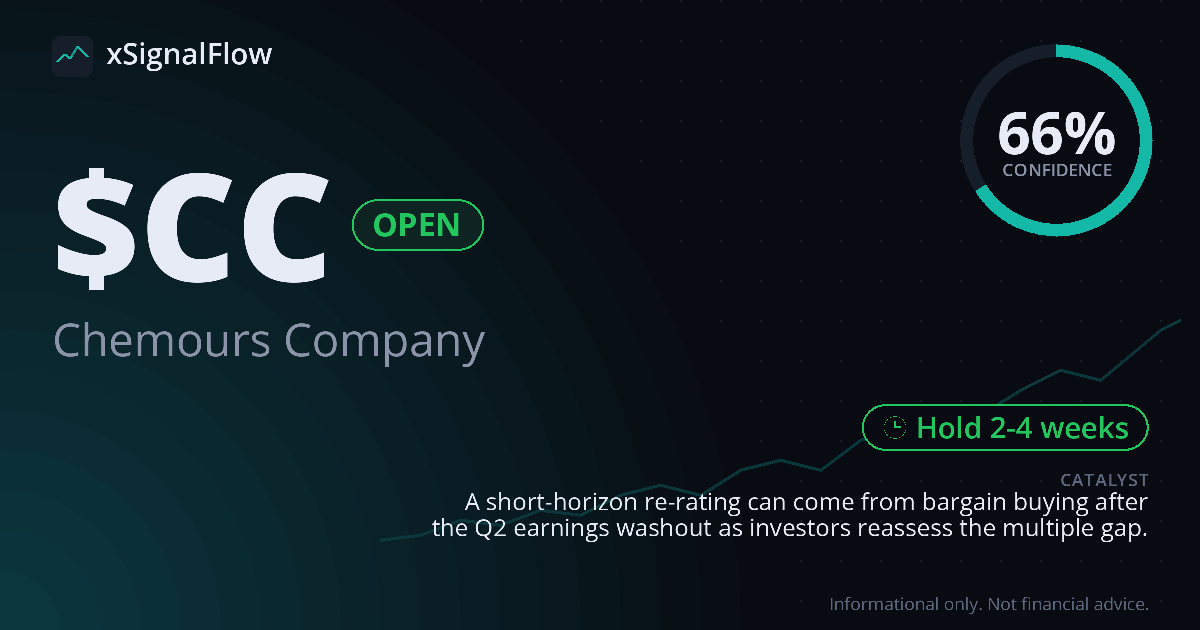
Angle Chemours is being valued at 7x forward earnings after a post-Q2 washout, versus a chemical-peer norm near 13x.
Chemours sold off sharply after Q2, with the stock dropping about 16.7% to $14.93 following missed revenue and earnings estimates [#21]. The reversal case is valuation-driven: at $16.61, Chemours was framed as trading around 7x next-year earnings versus a typical chemicals multiple near 13x, implying fair value near $29 [#30].
HOLD AI Status: Chemours sits oversold on stochastics and at the lower Bollinger band while weekly MACD histogram turns higher, against a still-strong downtrend below the EMA20.
Bollinger %B near 0.06 and bandwidth around 16% keep price pressed to the lower band, which fits a post-earnings washout where bargain hunters may reassess the valuation gap. Stochastics (%K near 7, %D near 15) flag oversold conditions, and the weekly MACD histogram is rising even with the close still below the SMA50 and RSI below its smoothed line. Daily trend remains down with EMA20 below slower averages, MACD rolling over, and lower highs, so the thesis stays intact but needs stabilization before a multiple re-rating can convincingly start.
Triangulation
Indicators as of Oct 15, 2026 12:15 PM PT
| Trend | CAUTION | EMA20<SMA50<SMA200 · ADX 34.2 strong · -7.2% vs EMA20 · close<EMA20 · -DI > +DI |
| Momentum | WATCHING | RSI 29.1 · RSIw 33.3 · MACD rolling over · hist -0.05 · MACD<signal |
| Stochastics | HOLD | %K/7 · %D/15 · oversold |
| Bollinger | HOLD | %B 0.03 · lower band · BW 16.2% · ATR 3.9% |
| Weekly | WATCHING | RSIw 30.9 · RSI<RSI-SMA · hist -0.49 · hist rising · close<SMA50 |
| Price action | WATCHING | 20d 6% · 52w 13% · lower highs (3) |
| Volume | HOLD | 1.09x avg · OBV ↓ |
| Position | CAUTION | PnL -13.25% · peak +10.21% · dd -15.41% · 48d held |
Tweet citations