Held45 days
Entry$141.60Close$162.91PnL+15.05%
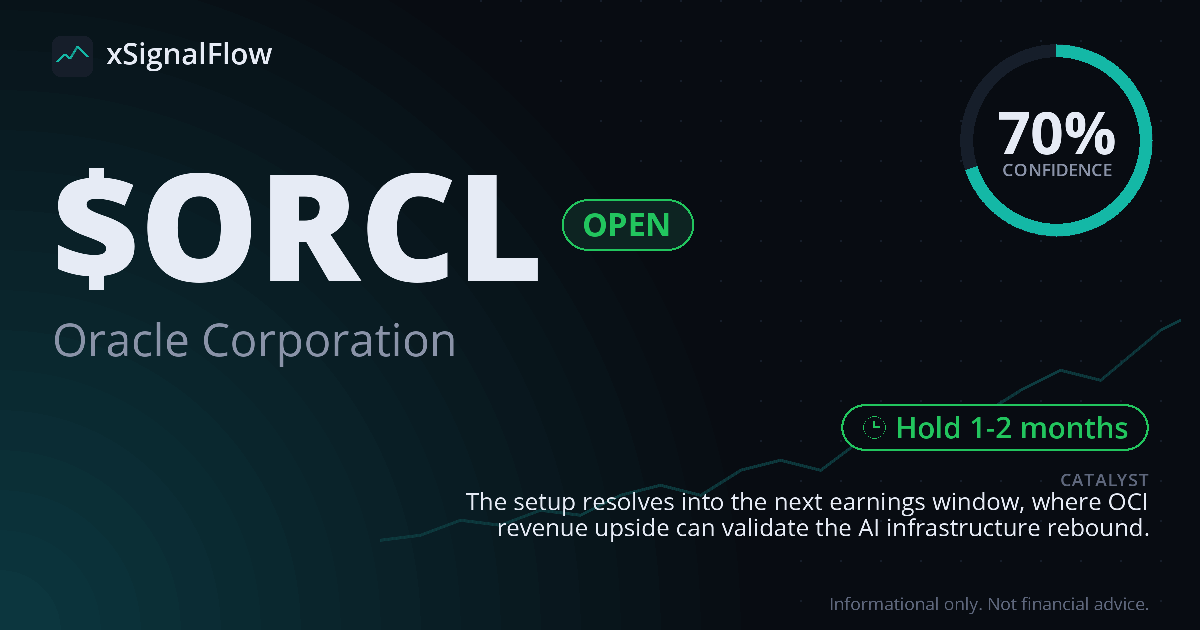
70%
confidence
Angle OCI upside is the cleaner why-now: a 43% drawdown meets a $2.2B cloud revenue surprise setup.
Oracle has washed out hard, falling from $248 to roughly $142 since June 1 while the AI backlog/RPO narrative remains central to the bull case [#2]. The near-term re-rate hook is earnings: Piper Sandler defended the stock ahead of the print and flagged roughly $2.2B of potential OCI revenue upside, while Barron's noted the rebound could snap Oracle's longest losing streak since 2021 [#13, #22, #34]. Valuation support adds a floor, with GF Value at $184.27 and long-term AI/cloud growth expectations still intact [#14].
AI Status: Oracle closed up 15.05% after a 45-day run that peaked near 20% before giving back modest gains off the high.
The pick entered at 141.60 and exited with a realized gain of 15.05%, capturing most of a rebound from the June washout while trailing the +20.07% peak by roughly four points. Along the way the position weathered an 18.98% drawdown from entry before momentum rebuilt. At close, RSI sat near 64 with MACD histogram still rolling up, though stochastics were stretched into overbought territory above the upper Bollinger band. Our exit signal closed the trade as it ran its course.